Designing a Non-Blocking Diagnostics Pipeline for OCPI Integrations
Modern EV charging platforms are highly integration-heavy systems. They exchange data with many external parties using protocols such as OCPI, covering modules like locations, tariffs, tokens, sessions, commands, and charging records. In this kind of environment, protocol communication is not just a background detail. When something goes wrong between two platforms, engineers often need to understand what was sent, what came back, how the response was interpreted, and which correlation ID connects the whole flow.
That is where diagnostic events become useful. A diagnostics pipeline can capture protocol-level information such as request metadata, response metadata, status codes, partner references, correlation IDs, and carefully trimmed payloads. This kind of data is extremely valuable when investigating failed pushes, unexpected responses, payload issues, or partner-specific behavior.
However, diagnostics have an important constraint: they should not slow down or break the main business flow. If a platform is publishing an OCPI event to an external party, the success of that operation should not depend on whether a diagnostic event was successfully written to a telemetry store. Diagnostics should be best-effort.
But best-effort does not mean careless.
A diagnostics pipeline still needs clear backpressure behavior, bounded memory usage, efficient publishing, protection against oversized payloads, and graceful shutdown handling. Otherwise, during traffic spikes, the system may start dropping useful diagnostic data exactly when engineers need it most.
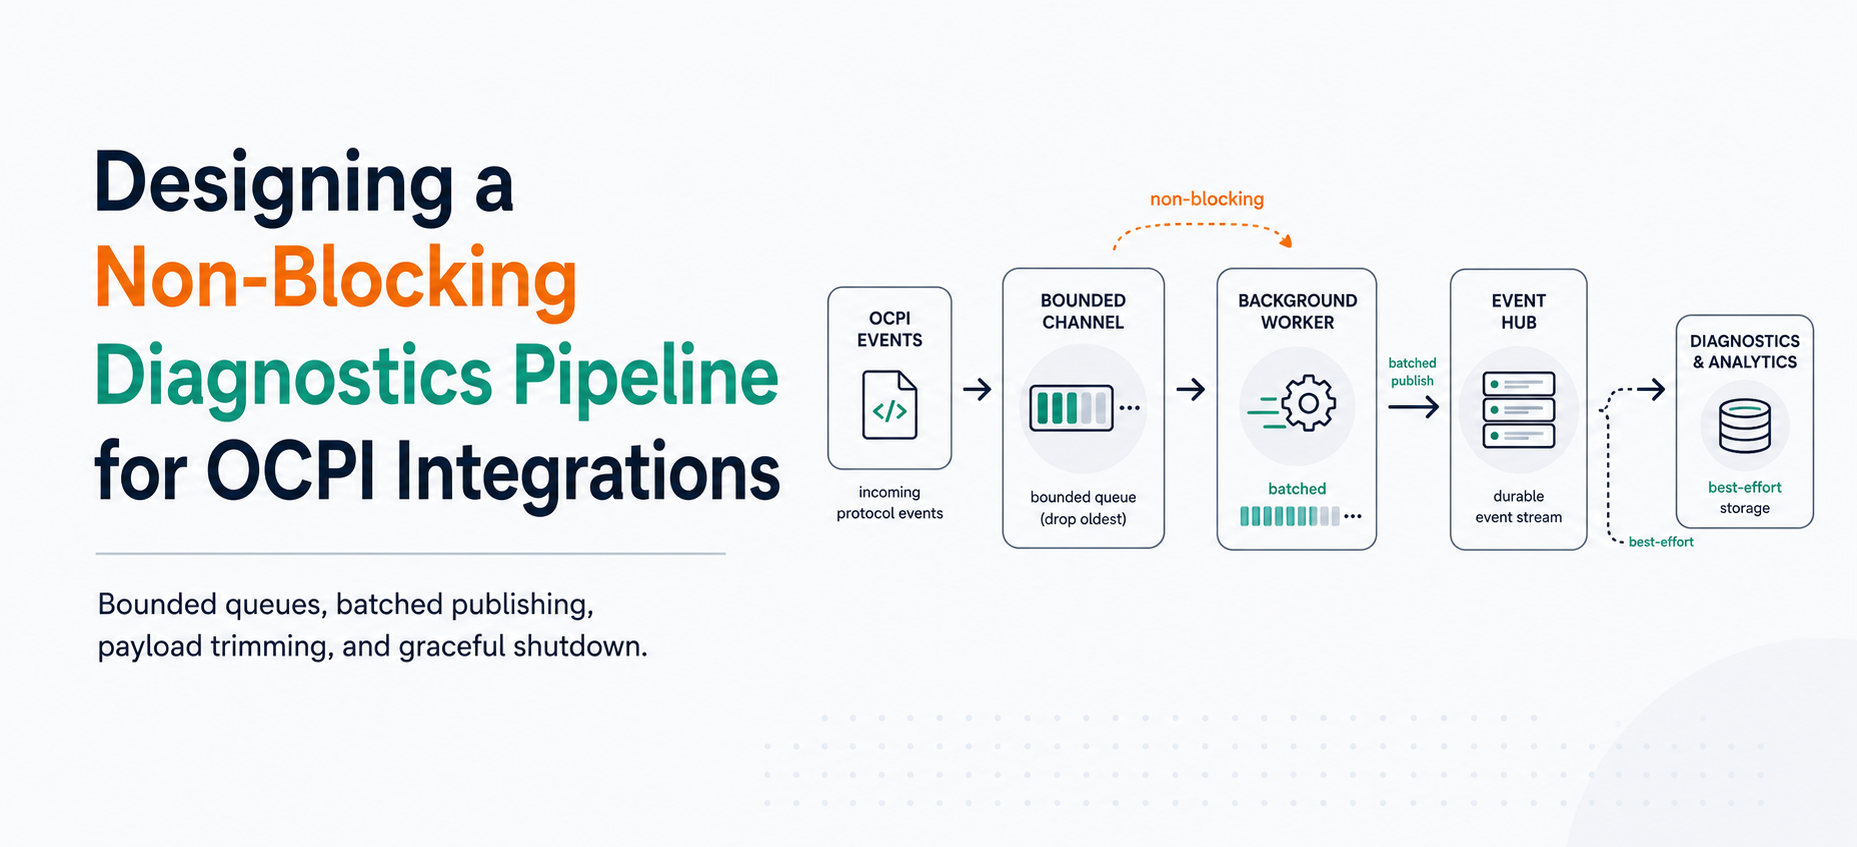
In this post, I want to walk through the journey of improving a diagnostics publishing flow: from a simple fire-and-forget implementation to a more resilient, non-blocking, batched diagnostics pipeline. The goal was not to guarantee every diagnostic event. The goal was to keep diagnostics off the critical path while making the pipeline more efficient, observable, and predictable under load.
The Problem: Best-Effort Diagnostics Under Load
The existing diagnostics flow followed a common pattern: the main protocol publishing flow created a diagnostic event, pushed it into an in-memory queue, and then continued without waiting for the diagnostic event to be published. A background processor was responsible for reading from the queue and sending the diagnostic data to a streaming system.
At a high level, this was the right idea. Diagnostics should not be on the critical path. If a platform is publishing protocol data to an external party, that operation should not become slower or fail just because a diagnostic event could not be written.
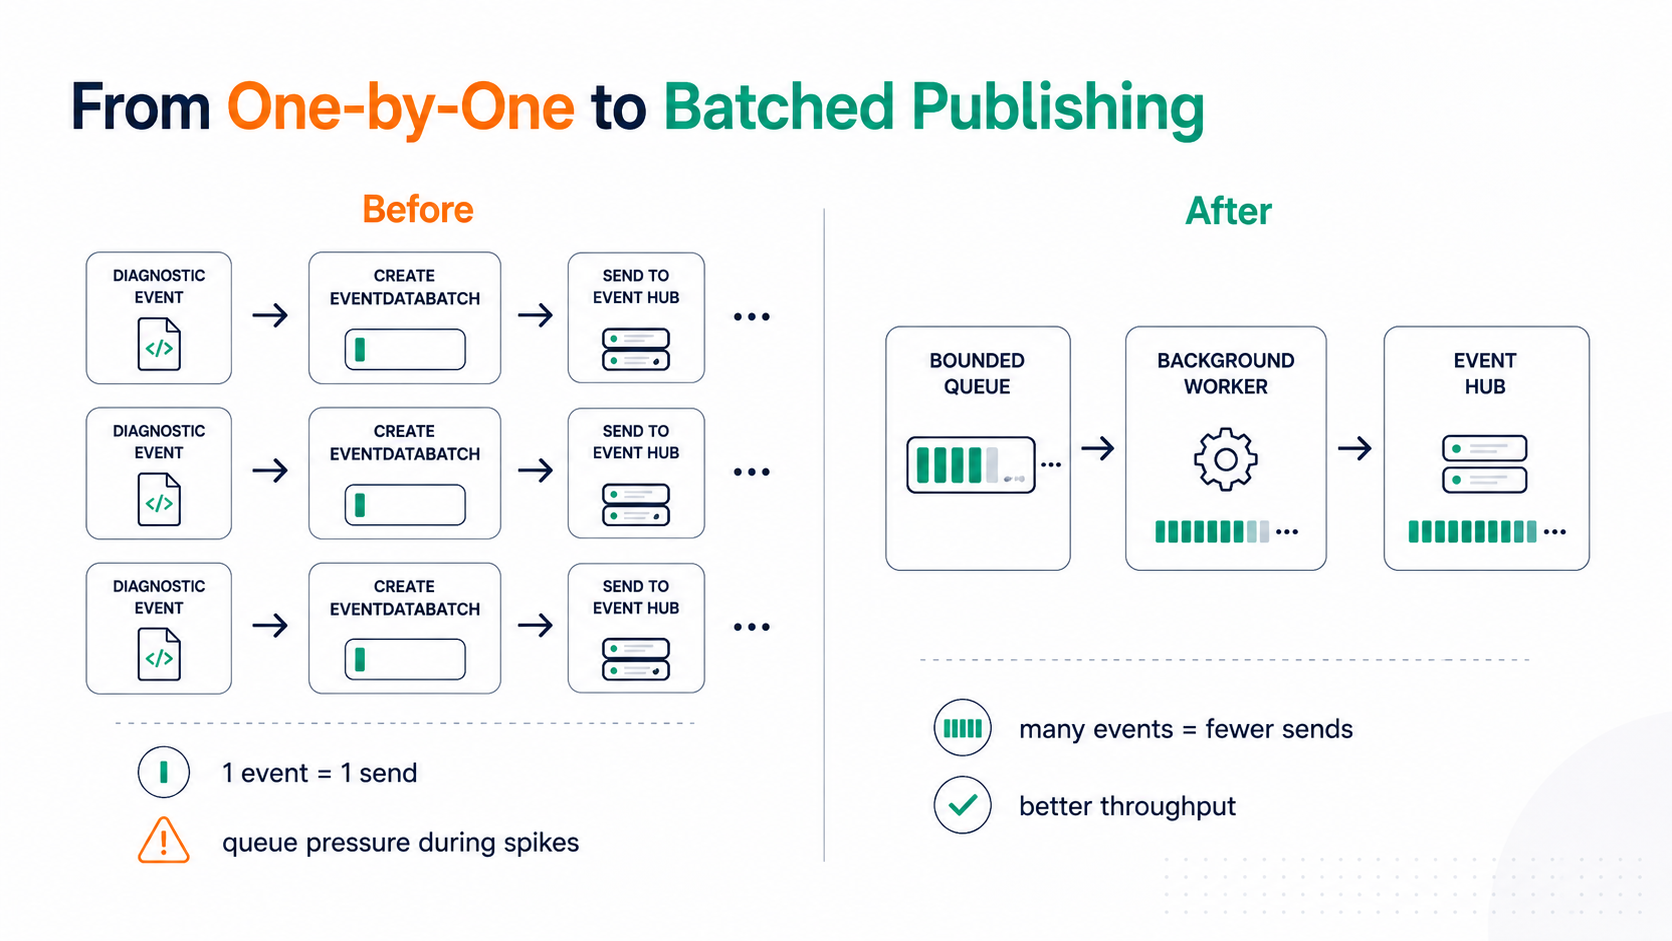
However, the implementation had an important limitation: diagnostic events were effectively published one by one. For every diagnostic event, the background processor created an Event Hub batch, added a single event to it, and sent that batch immediately.
That approach is simple and easy to understand, but it does not scale well during traffic spikes. When many protocol events are processed in a short period of time, the application can enqueue diagnostic events faster than the background sender can publish them. Because the queue is bounded, it eventually becomes full. At that point, the system has to start dropping diagnostic events.
Dropping diagnostics was acceptable from a business-flow perspective, because diagnostics were intentionally best-effort. But from an observability perspective, it was not ideal. The system could lose useful troubleshooting data exactly during the periods when that data was most valuable.
There were also some smaller but important issues around failure visibility and payload handling. Oversized diagnostic events were not handled explicitly enough. Request and response body trimming needed to be applied consistently before publishing. And the shutdown behavior of the in-memory queue was not very clear.
So the problem was not that diagnostics had to become guaranteed. They did not. The problem was that the best-effort pipeline needed to be more efficient, more bounded, and more predictable. We wanted to keep diagnostics away from the critical path, but reduce unnecessary drops and make failure scenarios easier to understand.
The New Approach: Bounded, Batched, and Non-Blocking
The goal was not to turn diagnostics into a guaranteed delivery mechanism. That would have changed the nature of the feature and could have made the main protocol flow dependent on the diagnostics pipeline. Instead, the goal was to keep diagnostics best-effort while making the implementation more efficient and predictable.
The new design was based on a few principles.
First, diagnostics should stay outside the critical path. The main publishing flow should only try to enqueue a diagnostic event and then continue. It should not wait for the event to be written to Event Hub.
Second, the queue should be bounded. Diagnostic data is useful, but it should never be allowed to grow memory usage without limits. If the application is under heavy load and the diagnostics pipeline cannot keep up, the system should make an explicit decision to drop diagnostic events and log that decision.
Third, publishing should be batched. Sending one diagnostic event at a time is simple, but inefficient during bursts. A background worker can collect multiple diagnostic events and send them together, either when the batch reaches a configured size or when a short flush interval expires.
Finally, failure scenarios should be visible. If a diagnostic event is too large, invalid, or cannot be queued because the buffer is full, the system should log that clearly. Diagnostics are still best-effort, but losing them should not be silent or confusing.
At a high level, the new pipeline looks like this:
Protocol publishing flow
- create diagnostic event
- try to enqueue into bounded channel
- return immediately
Background worker
- read diagnostic events
- group them into batches
- publish batches to Event Hub
- log and drop invalid or oversized events
This keeps the main flow fast and non-blocking, while giving the diagnostics pipeline a better chance to keep up during traffic spikes.
Implementing the Non-Blocking Queue
The first part of the redesign was the boundary between the main protocol flow and the diagnostics pipeline.
The main flow should be able to create a diagnostic event and hand it over quickly. It should not wait for Event Hub, network I/O, batching, retries, or serialization failures. Diagnostics are useful, but they should not become a dependency for the main operation.
To achieve that, I used a bounded Channel.
_messageQueue = Channel.CreateBounded<DiagnosticMessageEnvelope>( new BoundedChannelOptions(_options.BoundedCapacity) { SingleReader = true, SingleWriter = false, FullMode = BoundedChannelFullMode.Wait });
There are a few important choices here.
SingleReader = true means there is one background worker responsible for reading diagnostic messages from the queue. This keeps batching simple because only one worker builds and sends batches.
SingleWriter = false means multiple request-handling flows can write diagnostics concurrently. In a protocol publishing service, many operations may try to create diagnostic events at the same time.
The queue is also bounded. This is important because diagnostics should never cause unbounded memory growth. If traffic spikes and the diagnostics worker cannot keep up, the system should have a clear backpressure behavior.
In this case, the main flow does not block. It uses TryWrite:
public void Send(
    EventMessage eventMessage,
    SendDiagnosticsOptions? options = null,
    Dictionary<string, object>? additionalEntries = null)
{
    if (eventMessage is null || string.IsNullOrWhiteSpace(eventMessage.CorrelationId))
    {
        _logger.LogWarning(
            "[OcpiDiagnostics] Diagnostic event was not queued because event message or correlation id is missing.");
            return;
    }
    var envelope = new DiagnosticMessageEnvelop(
        eventMessage,
        options ?? new SendDiagnosticsOption(),
        additionalEntries);

    if (!_messageQueue.Writer.TryWrite(envelope))
    {
        _logger.LogError(
            "[OcpiDiagnostics] Failed to queue diagnostic event. Reason: diagnostics queue is full.",
            correlationId: eventMessage.CorrelationId);
    }
}
This is the key best-effort decision.
If the queue has capacity, the diagnostic event is accepted and the caller continues immediately. If the queue is full, the event is dropped and the reason is logged. The main protocol operation is not delayed and does not fail because of diagnostics.
This gives the diagnostics pipeline a clear contract:
- Accepted into the queue -> processed asynchronously
- Queue full -> dropped and logged
- Invalid diagnostic event -> dropped and logged
That behavior is intentional. A diagnostics pipeline should be useful and efficient, but it should not be allowed to put pressure back on the business-critical path.
I also added a shutdown guard:
if (Volatile.Read(ref _disposeStarted) == 1)
{
    _logger.LogWarning(
        "[OcpiDiagnostics] Diagnostic event was not queued because handler is shutting down.");

        return;
}
This prevents new diagnostic events from being accepted while the handler is disposing. Without this guard, the application could still try to enqueue diagnostics while the background worker is already being stopped.
At this point, the main flow has only one responsibility: try to enqueue the diagnostic event. Everything after that, batching, serialization, Event Hub publishing, oversized-event handling, and shutdown draining, belongs to the background diagnostics worker.
Batching Diagnostic Events Before Publishing
Once diagnostic events are safely outside the critical path, the next challenge is publishing them efficiently.
The previous implementation was simple: each diagnostic event was processed individually. For every event, the background processor created an Event Hub batch, added one diagnostic event to it, and sent it immediately.
Conceptually, the flow looked like this:
1 diagnostic event -> 1 Event Hub batch -> 1 send operation
That works, but it is not very efficient during bursts of traffic. Event Hub is designed to support batching, so sending every diagnostic event separately means we are not using the publishing model effectively. When many protocol events are processed in a short period of time, the diagnostics worker can spend too much time performing many small send operations instead of sending fewer, larger batches.
The improved approach is to collect diagnostic events in the background worker and publish them in batches.
many diagnostic events -> 1 Event Hub batch -> 1 send operation
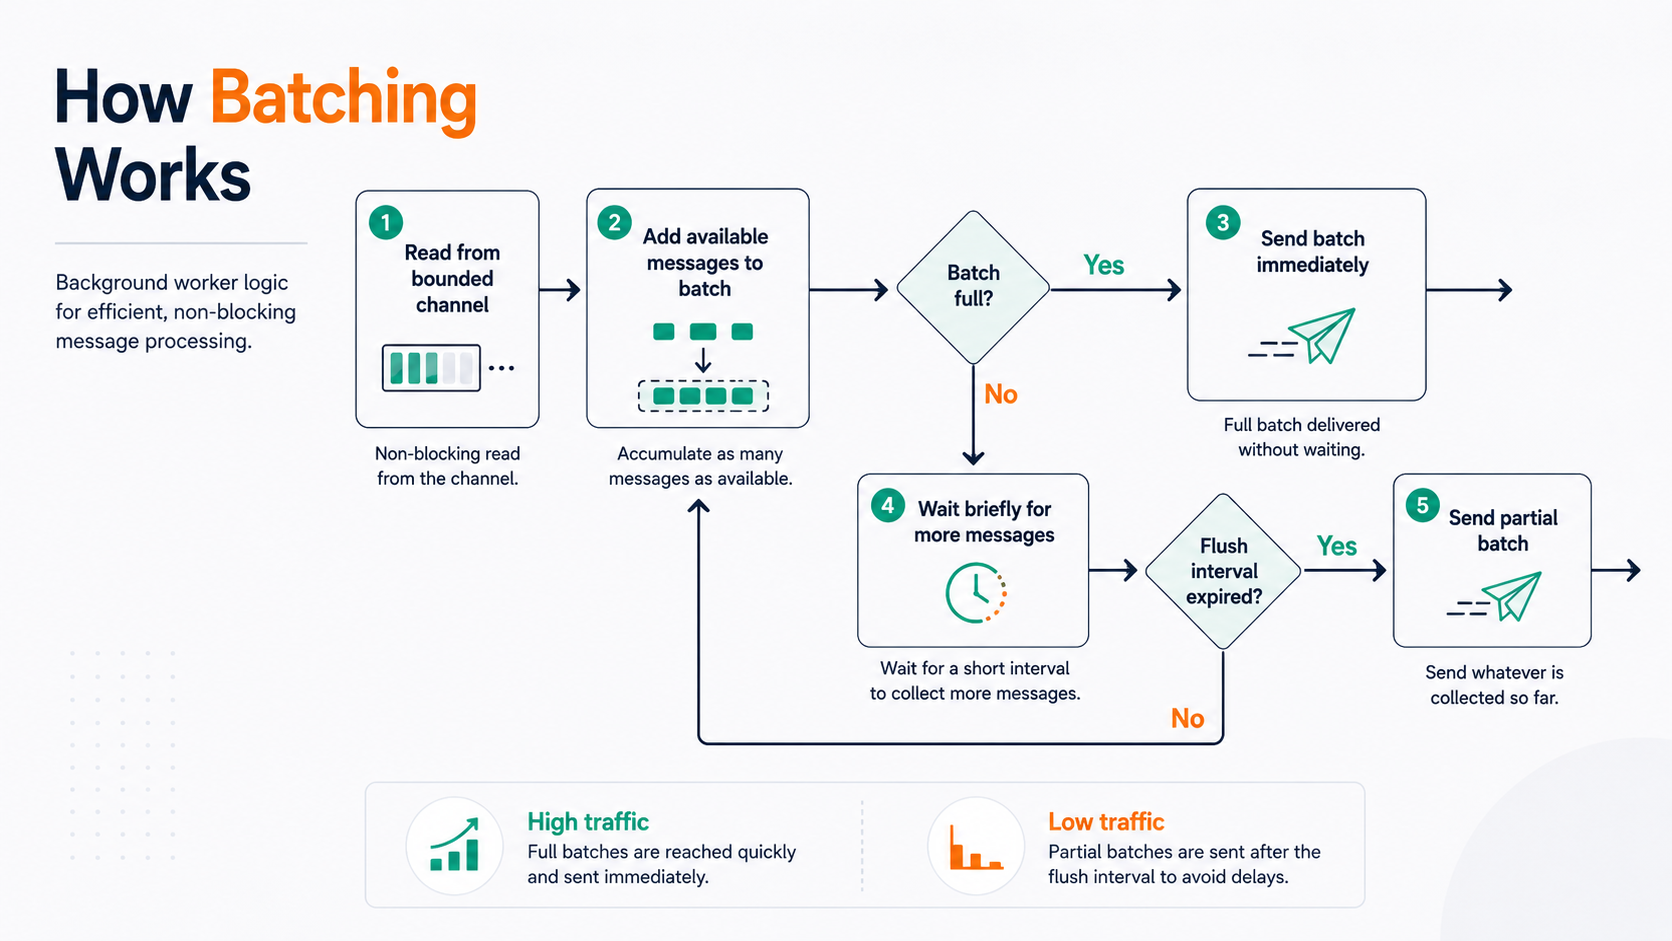
The batching logic is based on two simple rules:
Flush the batch when:
- the batch reaches the configured maximum size
- or a short flush interval expires
The first rule helps during high traffic. If many diagnostic events are available, the worker can quickly build full batches and publish them without waiting unnecessarily.
The second rule helps during low traffic. If only one or two diagnostic events are available, we do not want to keep them in memory forever while waiting for a full batch. After a short interval, the partial batch is flushed.
A simplified version of the worker flow looks like this:
private async Task ProcessQueueAsync()
{
    await foreach (var batch in ReadBatchesAsync(_stoppingCts.Token))
    {
        await SendBatchAsync(batch, _stoppingCts.Token);
    }
}
The worker itself does not care whether the batch was created because it became full or because the flush interval expired. It only receives batches and publishes them.
The batching logic is handled separately:
private async IAsyncEnumerable<IReadOnlyCollection<DiagnosticMessageEnvelope>> ReadBatchesAsync( [EnumeratorCancellation] CancellationToken cancellationToken)
{
    var batch = new List<DiagnosticMessageEnvelope>(_options.MaxBatchSize);
    while (await _messageQueue.Reader.WaitToReadAsync(cancellationToken))
    {
        while (AddAvailableMessagesToBatch(batch, cancellationToken))
        {
            yield return batch.ToArray();
            batch.Clear();
        }
        if (batch.Count == 0)
        {
            continue;
        }
        var flushDelayTask = Task.Delay(
            TimeSpan.FromMilliseconds(_options.FlushIntervalInMilliseconds),
            CancellationToken.None);
        var waitForMoreDataTask = _messageQueue.Reader
            .WaitToReadAsync(cancellationToken)
            .AsTask();
        var completedTask = await Task.WhenAny(flushDelayTask, waitForMoreDataTask);
        if (completedTask == flushDelayTask)
        {
            yield return batch.ToArray();
            batch.Clear();
            continue;
        }
        if (!waitForMoreDataTask.Result)
        {
            yield return batch.ToArray();
            batch.Clear();
        }
    }

    while (AddAvailableMessagesToBatch(batch, cancellationToken))
    {
        yield return batch.ToArray();
        batch.Clear();
    }

    if (batch.Count > 0)
    {
        yield return batch.ToArray();
    }
}
The important part is that the batching logic has two paths.
The fast path is used when there are many diagnostic events already available in the channel. In that case, the worker keeps draining available messages and yields full batches immediately.
while (AddAvailableMessagesToBatch(batch, cancellationToken))
{
    yield return batch.ToArray();
    batch.Clear();
}
This avoids unnecessary waiting during traffic spikes.
The slow path is used when there is only a partial batch. In that case, the worker waits briefly to see if more diagnostic events arrive. If more data arrives, the loop continues and tries to complete the batch. If the flush interval expires first, the partial batch is sent.
var completedTask = await Task.WhenAny(flushDelayTask, waitForMoreDataTask);
if (completedTask == flushDelayTask)
{
    yield return batch.ToArray();
    batch.Clear();
    continue;
}
This gives a good balance between throughput and latency:
- High traffic -> send full batches quickly
- Low traffic -> send partial batches after a short delay
The result is still best-effort. Batching does not guarantee that every diagnostic event will be published. Events can still be dropped if the queue is full, if the application is forced to shut down, or if an individual event is too large. But batching reduces unnecessary pressure on the publishing side and gives the diagnostics worker a better chance to keep up during bursts.
This was one of the most important changes in the redesign. The main flow remains non-blocking, but the background worker now publishes diagnostic events in a way that is much more suitable for high-volume protocol communication.
Publishing Batches to Event Hub
Batching diagnostic messages in memory is only half of the work. The next step is converting those messages into EventData and publishing them to Event Hub safely.
 This is an important distinction. A batch in our application is just a collection of diagnostic messages. But Event Hub has its own limits for how large an event or batch can be. That means we cannot simply assume that every diagnostic message will fit into the Event Hub batch.
The publishing flow looks like this:
diagnostic envelopes
- create EventData for each envelope
- add EventData to EventDataBatch
- send EventDataBatch to Event Hub
- log and drop invalid or oversized diagnostics
A simplified version of the batch publishing method looks like this:
private async Task SendBatchAsync(IReadOnlyCollection<DiagnosticMessageEnvelope> envelopes, CancellationToken cancellationToken)
{
    EventDataBatch? eventBatch = null;

    try
    {
        eventBatch = await _diagnosticsEventHubProducerClient.CreateBatchAsync(cancellationToken);
        foreach (var envelope in envelopes)
        {
            var eventData = CreateEventData(envelope, out var payloadSize);
            if (eventBatch.TryAdd(eventData))
            {
                continue;
            }
            if (eventBatch.Count > 0)
            {
                await SendEventBatchAsync(eventBatch, cancellationToken);
                eventBatch.Dispose();
                eventBatch = await _diagnosticsEventHubProducerClient.CreateBatchAsync(cancellationToken);
                if (eventBatch.TryAdd(eventData))
                {
                    continue;
                }
            }
            _logger.LogError(
                "[Diagnostics] Diagnostic event is too large for Event Hub and will be dropped.",
                correlationId: envelope.EventMessage.CorrelationId,
                customProperties: new Dictionary<string, object>
                {
                    ["PayloadSize"] = payloadSize
                });
        }

        if (eventBatch.Count > 0)
        {
            await SendEventBatchAsync(eventBatch, cancellationToken);
        }

    }
    finally
    {
        eventBatch?.Dispose();
    }
}
The most important part of this method is the TryAdd check.
if (eventBatch.TryAdd(eventData))
{
    continue;
}
TryAdd tells us whether the event can fit into the current Event Hub batch. If it returns true, the event was added successfully. If it returns false, there are two possible reasons:
- The current batch is already full.
- The single diagnostic event is too large to fit into an empty batch.
Those two cases need different handling.
If the current batch already contains events, we send that batch first, create a new Event Hub batch, and try to add the event again.
if (eventBatch.Count > 0)
{
    await SendEventBatchAsync(eventBatch, cancellationToken);
    eventBatch.Dispose();
    eventBatch = await _diagnosticsEventHubProducerClient .CreateBatchAsync(cancellationToken);
    if (eventBatch.TryAdd(eventData))
    {
        continue;
    }
}
This handles the normal case where the batch is full, but the event itself is valid. Instead of dropping the event, we flush the current batch and continue with a new one.
If the event still cannot be added to a fresh empty batch, then the event itself is too large for Event Hub. In that case, the diagnostics pipeline logs the problem and drops the event.
_logger.LogError(
    "[Diagnostics] Diagnostic event is too large for Event Hub and will be dropped.",
    correlationId: envelope.EventMessage.CorrelationId,
    customProperties: new Dictionary<string, object>
    {
        ["PayloadSize"] = payloadSize
    }
);
This is another best-effort decision. A diagnostic event that is too large should not fail the main protocol flow, and it should not kill the background worker. It should be dropped with enough context to understand what happened.
Before adding an event to the Event Hub batch, the diagnostic message is converted into EventData.
private static EventData CreateEventData(
    DiagnosticMessageEnvelope envelope, out int payloadSize)
{
    var eventMessage = envelope.EventMessage;
    var eventHubEventMessage = eventMessage
        .Clone()
        .UpdateEventLevel()
        .TrimRequestAndResponseBody(envelope.Options)
        .UpdateResponseBody(envelope.Options.SendHttpGetResponseBodyToEventHub);

    var json = JsonSerializer.Serialize(eventHubEventMessage, JsonSerializerOptions);
    payloadSize = Encoding.UTF8.GetByteCount(json);
    var eventData = new EventData(json)
    {
        CorrelationId = eventMessage.CorrelationId,
        Properties =
        {
            ["action"] = "OcpiEvent",
            ["ocpiSubscriptionId"] = eventMessage.SubscriptionId
        }
    };

    if (envelope.AdditionalEntries != null)
    {
        foreach (var entry in envelope.AdditionalEntries)
        {
            eventData.Properties[entry.Key] = entry.Value;
        }
    }
    return eventData;
}
There are a few useful details here.
First, the diagnostic event is cloned before being modified. This prevents the diagnostics pipeline from accidentally changing the original event object used elsewhere in the application.
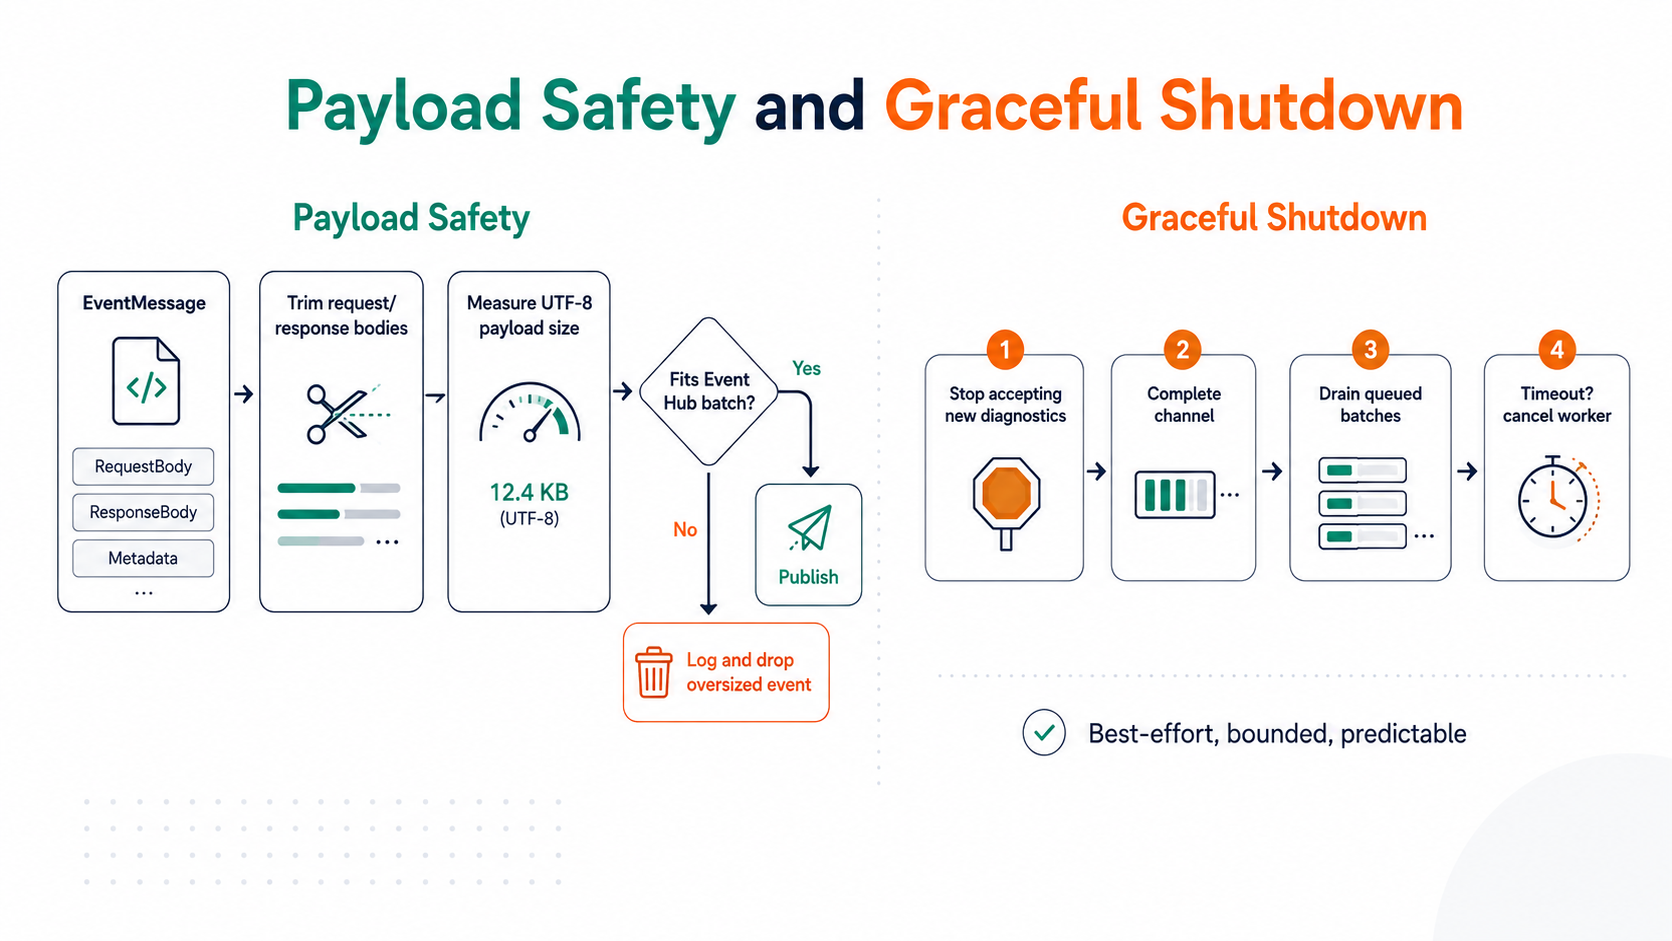
Second, request and response body trimming is applied before serialization. This keeps the event useful, but prevents large request or response bodies from producing unnecessarily large diagnostic messages.
Third, the payload size is measured in UTF-8 bytes.
payloadSize = Encoding.UTF8.GetByteCount(json);
This is more useful than checking the string length, because Event Hub limits are based on bytes, not C# characters. A string with non-ASCII characters may use more bytes than characters once encoded as UTF-8.
Finally, application properties are added to the EventData. These properties make it easier for consumers to route, filter, or identify diagnostic events without parsing the full JSON body.
The result is a publishing flow that is still best-effort, but much safer than simply sending one event at a time. The worker can publish multiple diagnostics efficiently, handle full batches correctly, detect oversized events, and continue processing later diagnostics even when one event is invalid or too large.
In other words, the diagnostics pipeline remains isolated from the critical path, but the publishing side becomes more predictable and easier to reason about.
Keeping Diagnostic Payloads Small
Batching improves how diagnostic events are published, but it does not solve every problem by itself. A batch is only efficient if the individual events inside it are reasonably small.
Diagnostic events can easily become large if they include full request bodies, full response bodies, long error messages, or large metadata objects. In protocol integrations, payloads can vary a lot. Some messages are small and simple, while others may contain large lists, nested objects, or partner-specific details.
For diagnostics, sending the full payload is not always necessary. The goal is usually to understand what happened, not to store an unlimited copy of every request and response. In many cases, a carefully trimmed payload is enough to investigate the issue while keeping the diagnostics pipeline lightweight.
That is why request and response body trimming is applied before the event is serialized and sent.
var eventHubEventMessage = eventMessage
    .Clone()
    .UpdateEventLevel()
    .TrimRequestAndResponseBody(envelope.Options)
    .UpdateResponseBody(envelope.Options.SendHttpGetResponseBodyToEventHub);
The important detail is that trimming happens before serialization. This means the object is reduced before it becomes the final JSON payload that will be sent to Event Hub.
The request and response limits are configured through SendDiagnosticsOptions.
public class SendDiagnosticsOptions
{
    public int MaximumRequestBodyLength { get;set; }= 1000;
    public int MaximumResponseBodyLength { get; set; } = 1000;
    public bool SendHttpGetResponseBodyToEventHub { get; set; } = true;
}
In this design, these limits are treated as character limits. That keeps the behavior easy to understand and preserves the original meaning of the configuration: keep at most a certain number of characters from the request and response body.
However, Event Hub size limits are not based on C# string length. They are based on bytes. This distinction matters because one character is not always one byte. For example, non-ASCII characters can take multiple bytes when encoded as UTF-8.
That is why the final serialized diagnostic event is measured using UTF-8 byte count:
var json = JsonSerializer.Serialize(
    eventHubEventMessage, JsonSerializerOptions
    );
payloadSize = Encoding.UTF8.GetByteCount(json);
This gives a more realistic view of the actual payload size being sent to Event Hub.
There are two different size concerns here:
- Field-level trimming: RequestBody and ResponseBody are trimmed by character count.
- Transport-level safety: The final serialized diagnostic event is measured in UTF-8 bytes. Keeping those two concepts separate makes the design easier to reason about. Character limits are useful for controlling how much request or response content is included. Byte size is useful for understanding whether the final event is safe and reasonable to send to Event Hub.
This also helps with oversized event handling. If a diagnostic event still becomes too large after trimming, it can be detected when adding it to the Event Hub batch. In that case, the event is dropped and logged instead of failing the main protocol flow.
_logger.LogError(
    "[Diagnostics] Diagnostic event is too large for Event Hub and will be dropped.",
    correlationId: envelope.EventMessage.CorrelationId,
    customProperties: new Dictionary<string, object>
    {
        ["PayloadSize"] = payloadSize
    }
);
This is another best-effort trade-off. A very large diagnostic event is usually less valuable than keeping the main system healthy. The diagnostics pipeline should capture enough information to investigate problems, but it should not send huge events that reduce batching efficiency, increase memory pressure, or risk hitting Event Hub limits.
In practice, this means diagnostics should contain the most useful troubleshooting information:
- correlation ID
- protocol module
- partner or subscription reference
- status code
- status message
- request and response metadata
- trimmed request or response body when useful
The goal is not to store everything. The goal is to store enough information to make investigation possible without turning diagnostics into a heavy data pipeline.
By trimming payloads early and measuring the final serialized event size in bytes, the diagnostics pipeline becomes safer and more predictable. It can still provide useful protocol-level visibility, but it avoids letting unusually large payloads dominate Event Hub batches or put unnecessary pressure on the background worker.
Graceful Shutdown
So far, the diagnostics pipeline has a clear flow: the main protocol operation tries to enqueue a diagnostic event, a background worker reads events from the queue, batches them, and publishes them to Event Hub.
But there is still one important lifecycle question:
What happens when the application is shutting down?
This matters because the diagnostics queue is in memory. If the process stops immediately, any diagnostic events still waiting in the queue can be lost. Since diagnostics are best-effort, losing some events during shutdown may be acceptable. But the system should still try to flush what it already accepted before stopping.
The shutdown flow should follow a simple sequence:
- Stop accepting new diagnostic events.
- Complete the queue.
- Let the background worker drain remaining events.
- Wait for a limited amount of time.
- If the worker does not finish, cancel it.
The first step is to mark the handler as disposing.
if (Interlocked.Exchange(ref _disposeStarted, 1) == 1)
{
    return;
}
This makes disposal idempotent. If shutdown is triggered more than once, only the first call performs the actual shutdown logic.
The same flag is also checked when new diagnostic events are sent:
if (Volatile.Read(ref _disposeStarted) == 1)
{
    _logger.LogWarning(
        "[Diagnostics] Diagnostic event was not queued because handler is shutting down."
        );
    return;
}
This prevents new diagnostic events from being accepted while the background worker is already stopping.
After that, the queue writer is completed:
_messageQueue.Writer.TryComplete();
Completing the writer tells the channel that no more messages will be written. The reader can then continue processing any items that are already buffered and exit naturally once the queue is empty.
The handler then waits for the background worker to finish:
await _workerTask.WaitAsync(TimeSpan.FromSeconds(5));
This gives the worker a short grace period to drain queued diagnostics and publish any remaining batches. The timeout is important because shutdown should not wait forever. Diagnostics are useful, but they should not block the application from stopping indefinitely. If the worker does not finish within the grace period, the shutdown path cancels it:
await _stoppingCts.CancelAsync();
At that point, any remaining diagnostics may be dropped. That is still consistent with the best-effort nature of the pipeline. The important part is that the system first tries to flush already accepted diagnostics, but still has a clear upper bound for shutdown time.
A simplified version of the disposal flow looks like this:
public async ValueTask DisposeAsync()
{
    if (Interlocked.Exchange(ref _disposeStarted, 1) == 1)
    {
        return;
    }

    _messageQueue.Writer.TryComplete();

    try
    {
        await _workerTask.WaitAsync(TimeSpan.FromSeconds(5));
    }
    catch (TimeoutException ex)
    {
        _logger.LogWarning(
            "[Diagnostics] Timed out while flushing diagnostics queue. Cancelling worker.",
            exception: ex
            );
        await ForceStopWorkerAsync();
    }
    finally
    {
        _stoppingCts.Dispose();
    }
}
The background worker also treats cancellation as an expected shutdown scenario:
catch (OperationCanceledException) when (_stoppingCts.IsCancellationRequested)
{
    // Expected during forced shutdown.
}
This avoids logging normal shutdown behavior as if it were an unexpected failure.
Graceful shutdown does not make the diagnostics pipeline guaranteed. It still uses an in-memory queue, and some events can be lost if the process is killed, the host shuts down forcefully, or the shutdown timeout expires.
But it does improve the behavior significantly. Instead of abandoning the queue immediately, the handler stops accepting new work, drains what it can, publishes remaining batches, and only cancels the worker if shutdown takes too long.
This keeps the lifecycle aligned with the overall design: diagnostics are best-effort, but they are handled deliberately.
What This Design Guarantees, and What It Does Not
This design improves the diagnostics pipeline, but it does not turn it into a guaranteed delivery mechanism.
It guarantees that diagnostics stay outside the critical path. The main protocol flow only tries to enqueue a diagnostic event and then continues. It does not wait for Event Hub.
It also guarantees bounded memory usage. The queue has a fixed capacity, so diagnostics cannot grow memory usage without limits.
The pipeline is more efficient because events are published in batches instead of one by one. It also handles expected failure cases more clearly: invalid events, full queues, oversized payloads, and shutdown behavior are logged instead of being silent or confusing.
But some things are still intentionally not guaranteed.
A diagnostic event can still be dropped if the queue is full, if the event is too large, if publishing fails, or if the application is forced to shut down before the queue is drained.
That is acceptable because diagnostics are best-effort. The important improvement is that the pipeline is now more predictable, more observable, and less likely to drop useful diagnostic data unnecessarily during normal traffic spikes.
Closing Thoughts
Diagnostics are easy to treat as a secondary concern because they are not part of the main business flow. But in integration-heavy systems, they often become one of the most important tools for understanding what actually happened between platforms.
The goal of this redesign was not to make diagnostic events guaranteed. That would have introduced a different set of trade-offs. The goal was to keep diagnostics best-effort while making the pipeline more efficient, bounded, and easier to reason about.
By moving diagnostic publishing behind a bounded queue, batching events before sending them, trimming large payloads, handling oversized events explicitly, and adding graceful shutdown behavior, the diagnostics flow became more predictable without putting pressure on the critical path.
For me, the main takeaway is simple: best-effort systems still deserve intentional design. They may not guarantee every message, but they should fail clearly, protect the main flow, and behave well under load.